Single rising bubble
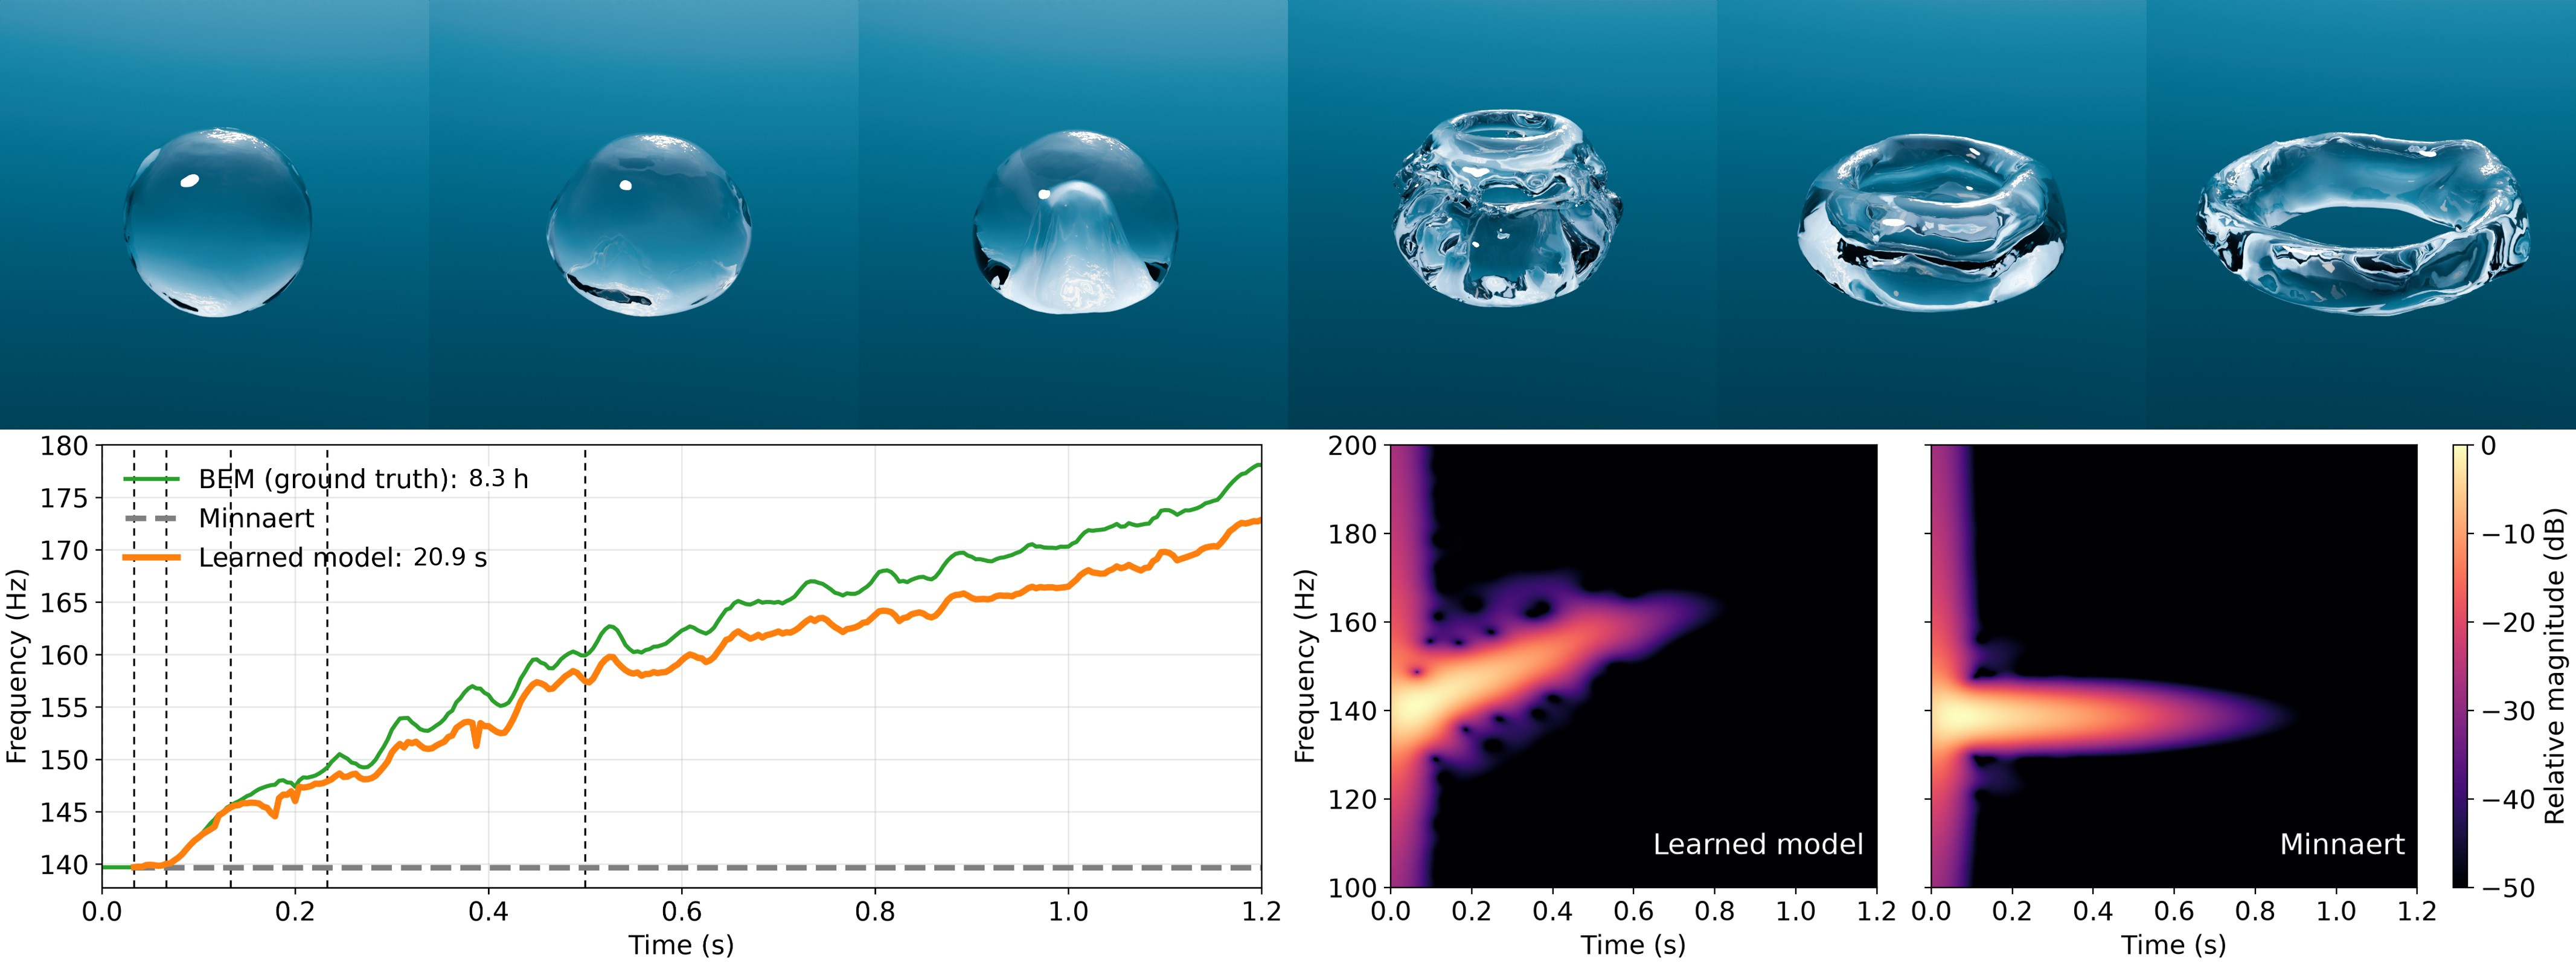
Figure 7 caption
Single rising bubble. A bubble deforms from a sphere into a torus as it rises (top, with frame times marked). We apply our model zero-shot to new bubbles outside the dataset, with no scene-specific fitting. BEM ground truth and the learned model both climb as the shape flattens while Minnaert stays fixed (bottom left; dashed lines mark the frames above). Our model stays within 1.65 % of BEM on average at a fraction of the cost, compared with Minnaert's 12.84 % error. The difference is audible in the rendered audio (bottom right).
From Table 1
For the single rising bubble, we solved BEM on all 282 mesh frames of the bubble in this figure, with no vertex cap; the other LBM scenes cap BEM at 5000 vertices.
Video
Files
| File | What it holds |
|---|---|
bub1_only_nocap_all_rows.csv |
one row per mesh frame: BEM frequency, assembly and solve times, surrogate frequency and timings, vertex counts |
bub1_bem_solve_timing.md |
the per-frame BEM ledger; the source of Table 1's 103603+2361 ms |
single_bubble_nn_timing.json |
the standalone surrogate pass; Table 1's 74.2 ms |
bub1_only_nocap_regressor_freqs.csv |
the baseline regressors on the same meshes |
vertex_scan.csv | vertex count per mesh |
README.md | Table 1's row for this scene, accounted cell by cell |
dataset/single_rising_bubble/ |
the scene; its BEM column covers bubble 1 only, the bubble this figure follows |